|
 |
 |
|||||||||||||||||||||||||
|
|||||||||||||||||||||||||||
|
|
|||||||||||||||||||||||||||
|
|
|||||||||||||||||||||||||||
|
|
|
||||||||||||||||||||||||||
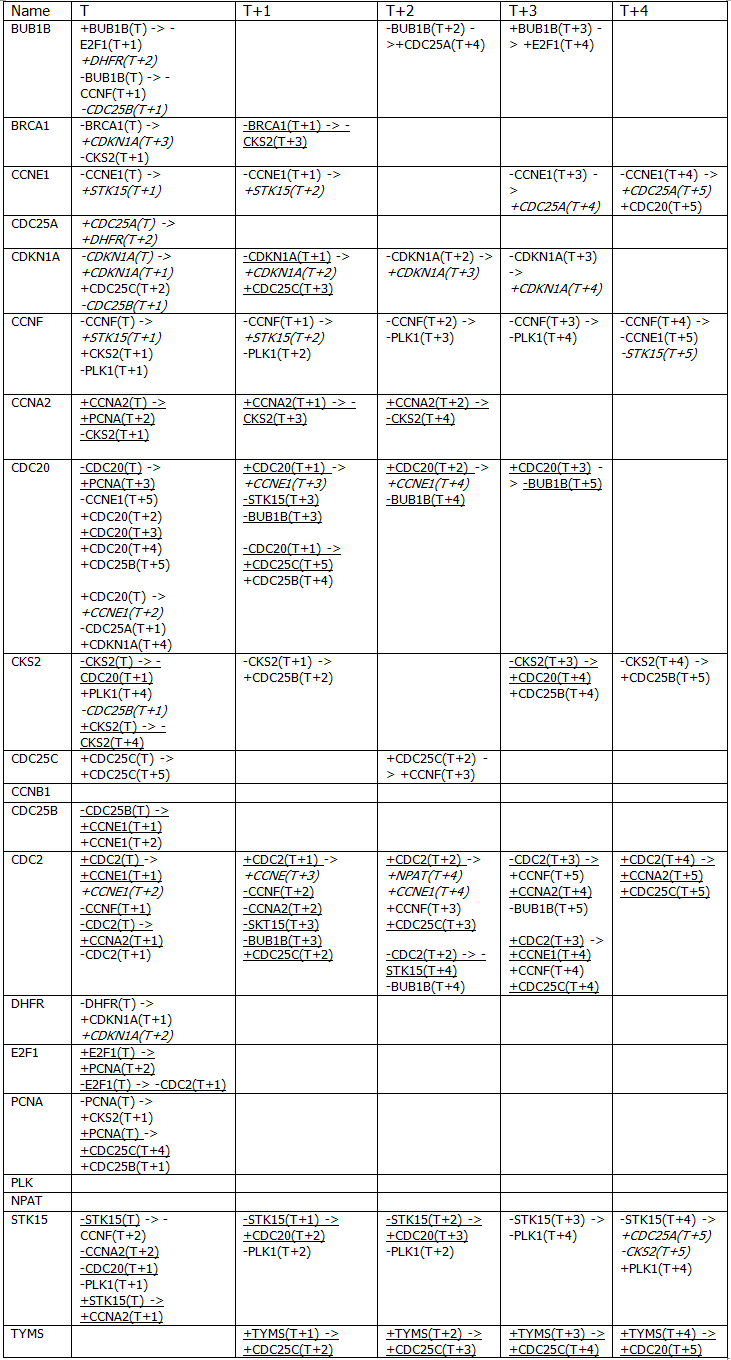
| Supplement 2 | |||||||||||||||||||||||||||
|
|
|||||||||||||||||||||||||||
|
|||||||||||||||||||||||||||
|
|||||||||||||||||||||||||||
|
|||||||||||||||||||||||||||
|
|
|
|
|
|
|
|
|||||||||||||||||||||
|
|
|
|
|||||||||||||||||||||||||
|
|||||||||||||||||||||||||||
|
|
|||||||||||||||||||||||||||
|
|
|||||||||||||||||||||||||||
|
|
|
||||||||||||||||||||||||||
| Supplement 2 | |||||||||||||||||||||||||||
|
|
|||||||||||||||||||||||||||
|
|||||||||||||||||||||||||||
|
|||||||||||||||||||||||||||
|
|||||||||||||||||||||||||||
|
|
|
|
|
|
|
|
|||||||||||||||||||||